Mobile-only web survey respondents
My breaks between posts are getting longer and longer. Sorry my dear readers. Today, I am writing about research done over a year ago that I did with Vera Toepoel and Alerk Amin.
Our study was about a group of respondents we can no longer ignore: Mobile-only web survey respondents. These are people, who do no longer use a laptop or desktop PC and use their smartphone for most or any of their Internet browsing, but instead use a smartphone. If we as survey methodologists want these people to answer our surveys, we have to design our surveys for smartphones as well.
Who are these mobile-only web survey respondents? This population may of course differ across countries. We used data from the American Life Panel, run by RAND, to investigate what this group looked like in the United States, using data from 2014 (so the situation today may be a bit different). The full paper can be found here
We find that of all people participating in 7 surveys conducted in the panel, 7% is mobile-only in practice. This is not a huge proportion, but it may matter a lot if these 7% of respondents are very different from other types of respondents. We find that they are.
In order to study how different these respondents are, we define 5 groups based on the device the use for responding to surveys:
1. Respondents who always use a PC for completing surveys. This the largest group (68%) and therefore serves as the reference group)
2. Respondents who always use a tablet (5%)
3. Respondents who always use a smartphone ( 7% - our group of interest)
4. Respondents who mix tablets and Pcs (7%)
5. Respondents who mix phones and Pcs (10%)
A further 1% uses all devices, but we ignore these respondents here.
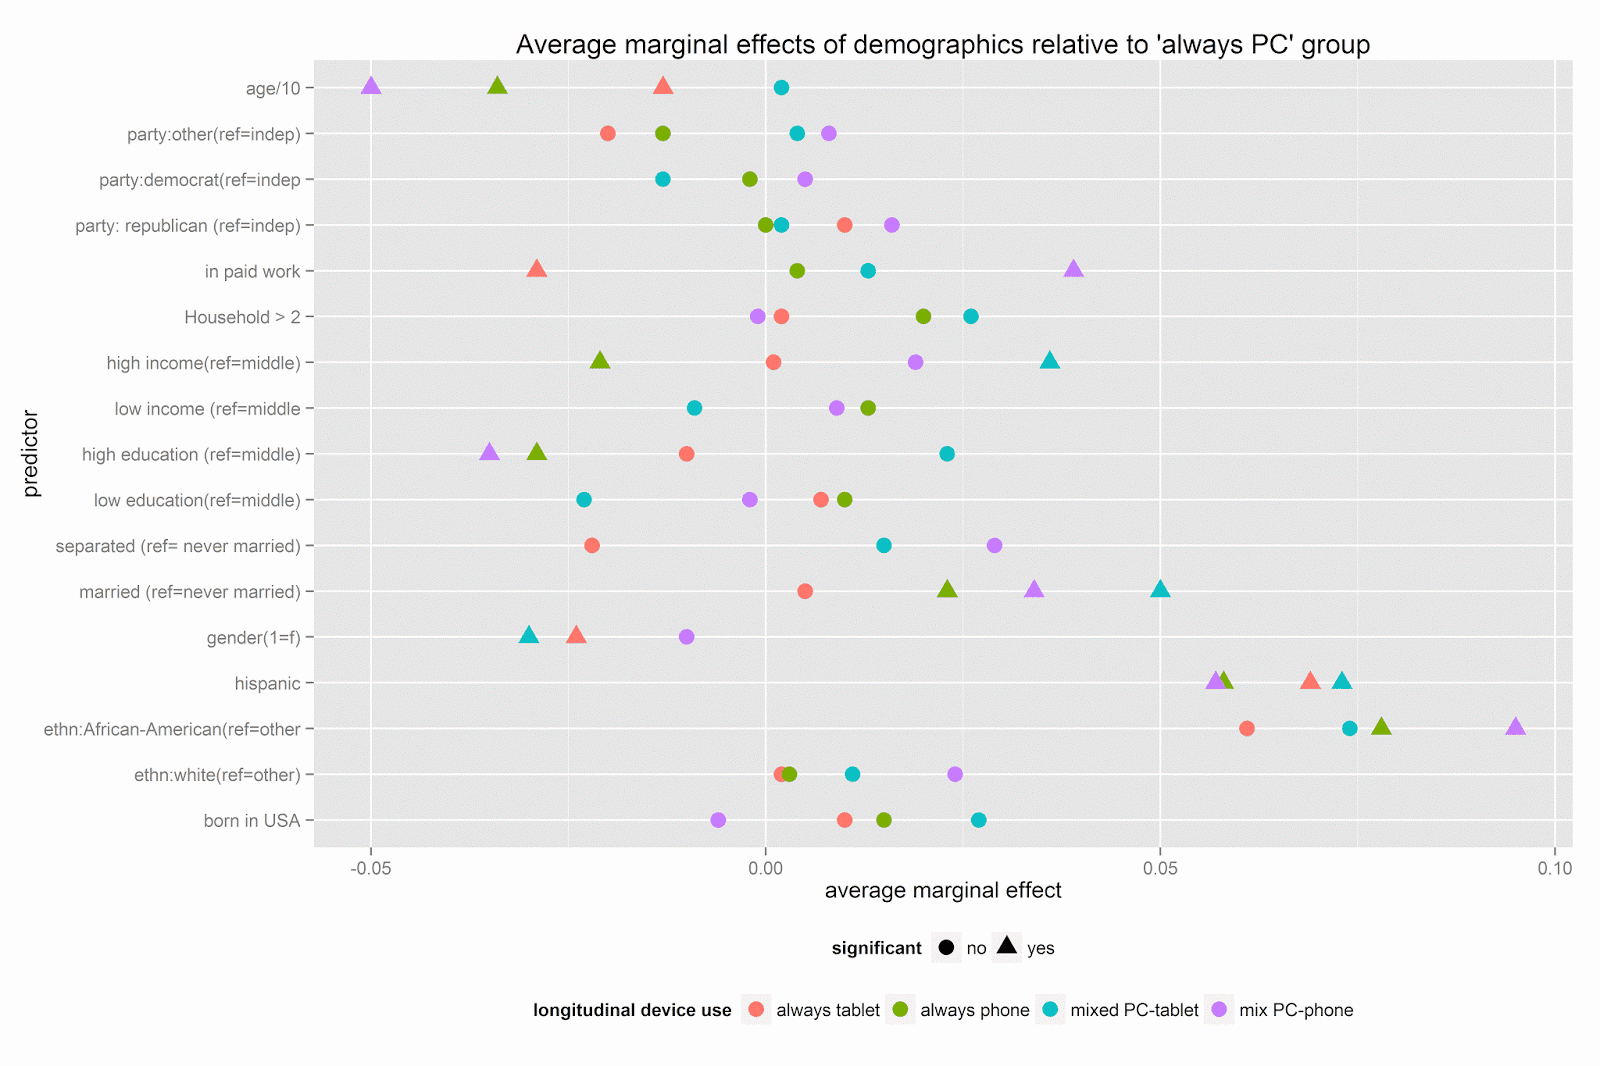
Click Figure to enlarge. The effects shown are always in comparison to the reference group, which is the ‘always PC’ group.
The 5 groups serve as our dependent variable in a multinomial logit regression. The average marginal effects shown in the Figure above respresent the change in the likelihood of being in the ‘always PC’ group as compared to one of the other groups. The negative age coefficient of -.03 for the always phone group means that with every decade respondents get younger (a negative effect), they have a .03 higher probability to be be in the always phone group as referred to the always Pc group. These effects seem small, but they are not. An imaginary respondent aged 60 has a predicted probability of 92 percent of being in the always PC group as opposed to the always phone group, but this probability is about 80 percent for someone aged 20, controlling for the effects of other covariates.
Our take-away? Apart from age, ‘Always phone’ respondents are also less likely to have a higher education (Bachelor degree or higher), are more likely to be married, and more likely to be of Hispanic or African American ethnicity. These characteristics coincide with some of the most important characteristics of hard-to-recruit respondents. While designing your surveys for smartphones will not get these hard-to-recruit respondents into your panel, you can easily lose them by not designing your surveys for smartphones.
Peter Lugtig
Professor data quality
I am full professor of data quality at Utrecht University, department of Methodology and Statistics.